AOC (Advanced Option Chain) vs. NSE and Other Option Chain: Unlock Smarter Trading Insights & Smart Money Tracking
Basic Of AOCRaj Shah

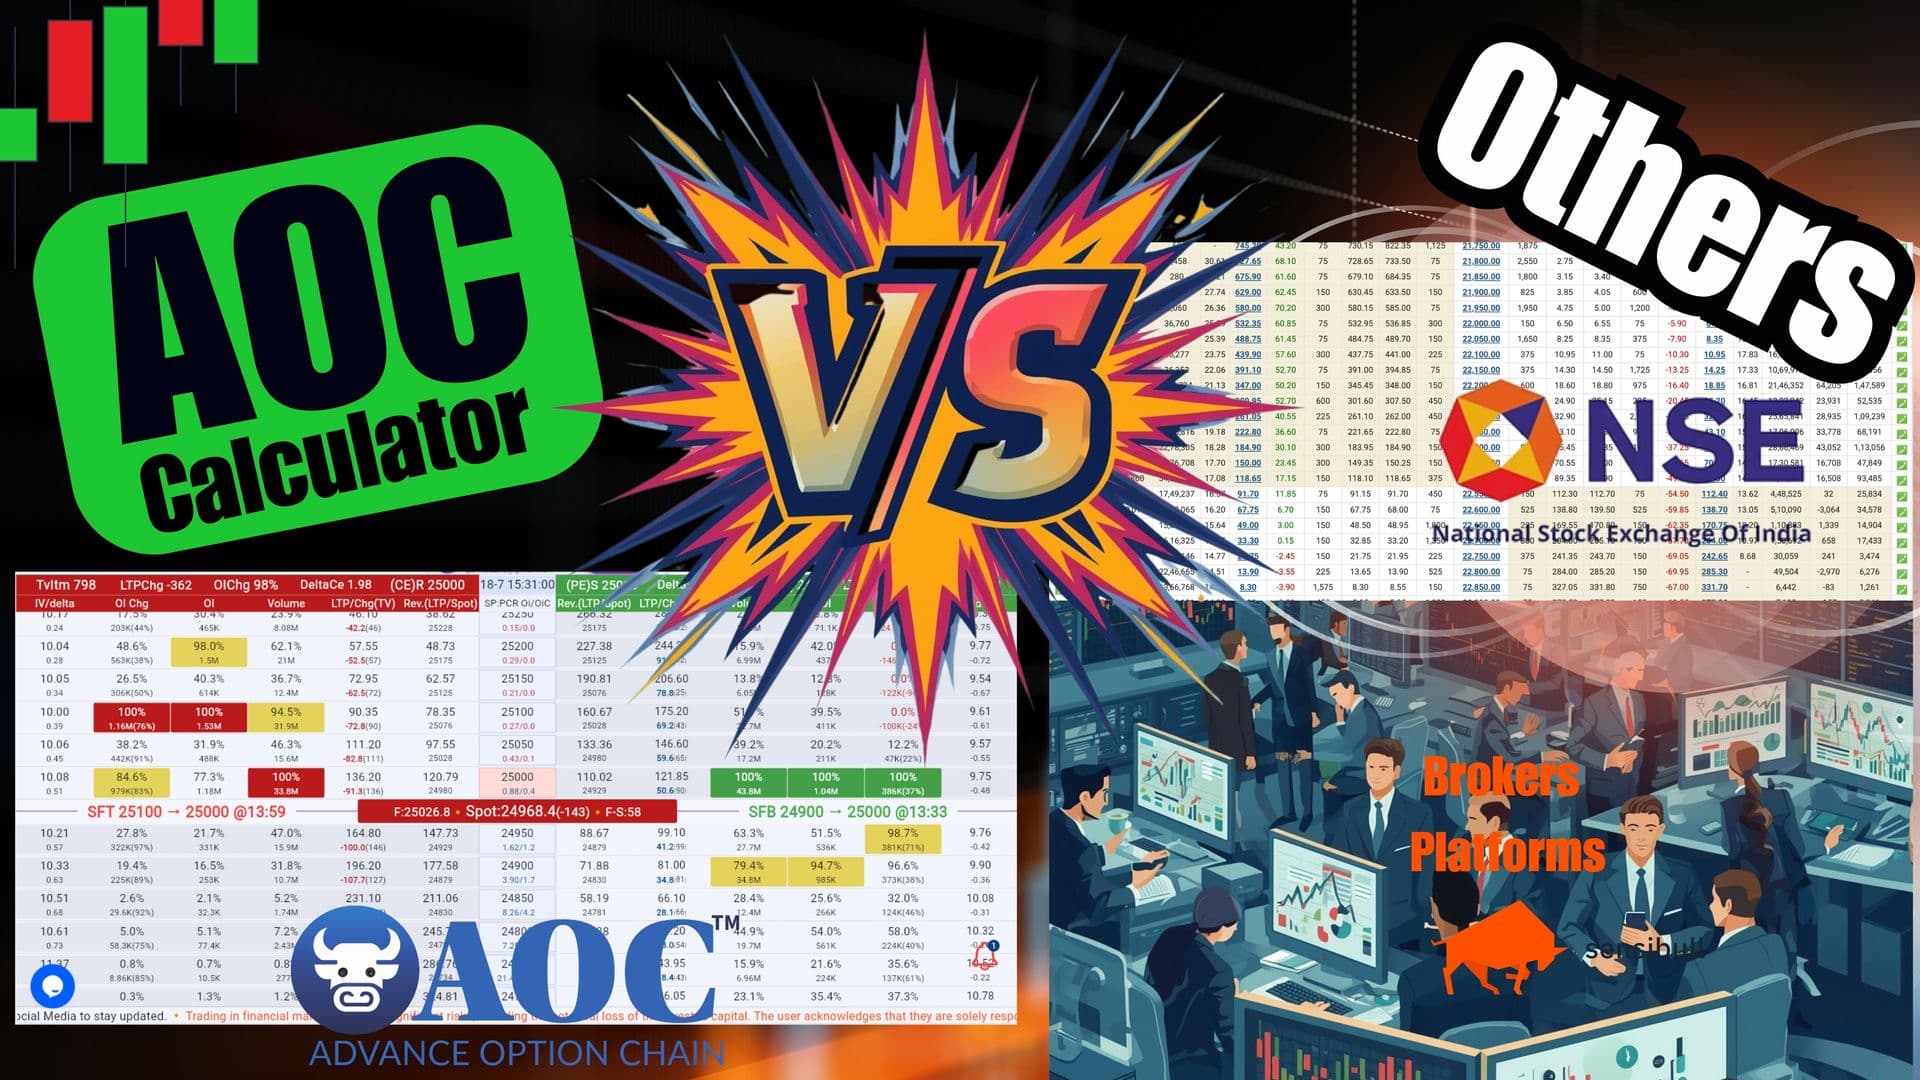
Why Clarity and Speed Matter in Options Trading
In the fast-paced world of options trading, the ability to make timely, informed decisions is paramount. Traders constantly seek an edge, relying on actionable insights to navigate market volatility and capitalize on opportunities. While the National Stock Exchange (NSE) Option Chain serves as a foundational tool, providing essential, real-time data, its limitations often leave modern traders wanting more.
The traditional NSE Option Chain offers basic information in a tabular format, showing open interest (OI), volume, and premiums. However, it often falls short in providing the depth of analysis, speed of updates, and intuitive visualizations necessary for truly strategic trading. This is where AOC (Advanced Option Chain) from AOCcalculator.in emerges as the next-generation solution. AOC transforms raw data into actionable intelligence, offering unmatched data visualization, instant support-resistance mapping, real-time insights, and sophisticated smart money tracking to empower traders to make faster and smarter decisions.
AOC vs. NSE Option Chain: A Feature-by-Feature Breakdown
The fundamental gap between the standard NSE Option Chain and an Advanced Option Chain like AOC is the distinction between basic information and advanced intelligence. While the NSE chain provides the raw data, AOC enriches this data with superior processing, visualization, and analytical tools, catering to traders seeking a deeper and more strategic understanding of the options market.
Here's a consolidated comparison highlighting the key differences:
Feature | NSE Option Chain | AOC (Advanced Option Chain) |
|---|---|---|
Reverse Table | ❌ Not Available | ✅ Allows intuitive analysis of OI shifts from a unique perspective |
Graphical Comparison | ❌ No Graphs | ✅ Visual representation of OI, Volume & Trend Analysis |
Real-Time Updates | ❌ Delayed Refresh | ✅ Dynamic S/R movement & data updates every few seconds |
Support & Resistance | ❌ No Color Coding | ✅ Color-coded (Green = Support, Red = Resistance) |
Smart Money Tracking | ❌ Not Available | ✅ Tracks institutional activity & big players movements |
Market Sentiment | ⚠ Limited | ✅ Predicts tendency using real-time OI shifts & volume |
Mobile Accessibility | Web Only | ✅ Available on Android, iOS, Mac, Windows |
These enhancements allow traders using AOC to identify shifting zones, spot emerging trends, and understand where the smart money is flowing with unparalleled clarity and speed.
Deep Dive: Exclusive Features That Make AOC the #1 Choice
AOCcalculator.in stands out as a sophisticated options trading platform, particularly popular among Indian options traders, for its array of exclusive features designed to deliver in-depth market insights and simplify complex option chain analysis.
Color-Coded Support & Resistance Zones
AOC simplifies complex options analysis by instantly visualizing critical price levels.
Green zones signify strong support levels, indicating heavy put writing or significant put volume, suggesting a price floor where buying interest is strong.
Red zones highlight strong resistance levels, pointing to high call writing or substantial call volume, acting as a ceiling for upward price movement.
This intuitive color-coding allows for rapid market interpretation, helping traders quickly identify potential reversals and breakout zones without extensive manual calculations, leading to quicker and more confident decision-making.
The Reverse Table: Human-Friendly Data Interpretation
Unlike conventional option chains, AOC features a unique "Reverse Table."
This innovative tool flips the Buy/Sell sides, offering a fresh, intuitive perspective on Open Interest (OI) and volume data.
It significantly improves the interpretation of OI and volume shifts, making it easier to pinpoint changing support and resistance levels.
The Reverse Table aids in analyzing institutional footprints by detecting where significant market players are positioning their trades, providing crucial insights into "smart money" movements.
Multi-OI Graphs for Visual Market Understanding
AOC transforms raw data into compelling visual narratives with its advanced graphing capabilities.
Strike-wise comparison allows traders to assess the strength of support and resistance zones across different strike prices.
Volume, OI, and OI Change trend mapping provides a clear visual representation of market dynamics.
These multi-OI graphs facilitate the comparison of historical data with live data, empowering traders to visually spot trend reversals and identify potential entry/exit points before they fully materialize.
Smart Money Tracking + Real-Time Data
For traders who demand the fastest and most accurate market intelligence, AOC delivers.
It boasts the fastest data refresh rate in the market, ensuring minimal lag in updates for critical metrics like Open Interest (OI) and volume shifts.
The platform actively identifies unusual OI spikes and detects institutional moves early, tracking the activity of "big players" and providing clues about potential market shifts.
By understanding where smart money is positioning, traders can stay ahead of the curve, anticipating market movements driven by large institutional participants.
Advanced Tools & Personalization
AOCcalculator.in is built to cater to every trader's needs, offering a suite of advanced tools and extensive customization options.
Intraday & swing stock filters help traders identify optimal stocks based on Open Interest trends and volume activity.
A clean and intuitive UI with custom settings ensures a personalized trading experience.
Robust backtesting & strategy refinement tools allow users to validate their trading strategies with over a year of data replay and customize time intervals.
Leveraging AI-powered insights, AOC can analyze market trends, predict direction, and support data-driven trading decisions.
From comprehensive market coverage for NSE F&O stocks, NIFTY, BANKNIFTY, and MCX commodities to advanced OI charts and light/dark theme options, AOC provides a highly customizable and efficient platform for enhanced strategy development and testing.
Conclusion: Ready to Upgrade Your Trading?
The contrast between the traditional NSE Option Chain and the advanced capabilities of AOC is clear. While the NSE chain offers fundamental data, AOC (Advanced Option Chain) provides a comprehensive, intelligent, and real-time analytical platform that empowers traders with deeper insights and actionable intelligence. For modern options traders seeking to optimize their decision-making, track smart money, and gain a significant edge, AOC is the definitive upgrade.
Ready to trade smarter, not just harder?
✔ Try AOC for Free: Visit AOCcalculator.in
✔ Join the Community for Live Insights and support.
AOCcalculator.in – Where Smart Traders Trade Smarter!