Unlock Options Trading: Identify Strong Support & Resistance with Advanced Option Chain (AOC)
Basic Of AOCRaj Shah

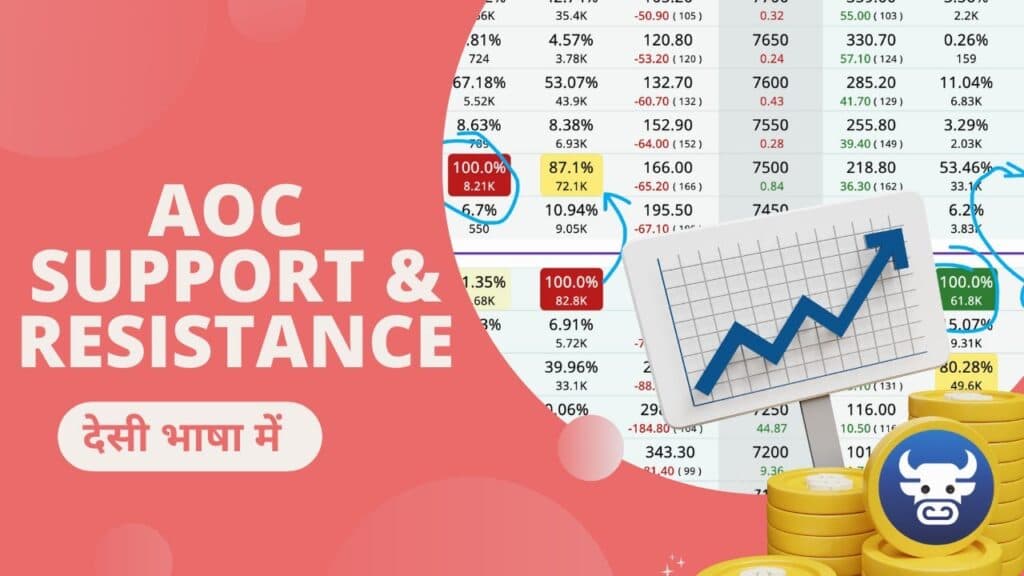
I. Introduction: Mastering Support & Resistance in Options Trading
In the fast-paced world of options trading, understanding market dynamics is paramount. Among the most crucial concepts for any trader are support and resistance levels. These levels are not merely lines on a chart; they are pivotal zones that help traders anticipate where the market may reverse, consolidate, or breakout. Recognizing these high-probability levels can significantly sharpen your options strategy and improve your trading decisions.
These vital zones are fundamentally shaped by the collective actions of institutional players and "smart money", primarily through their roles as Call Writers and Put Writers. Their extensive capital and strategic positioning in the options market directly influence supply and demand at specific strike prices, thereby establishing these critical price barriers.
The foundation of identifying these levels in the options market lies in three key metrics: Open Interest (OI), OI Change, and Volume. These metrics offer a real-time pulse on market sentiment and where significant capital is deployed. However, manually decoding this complex data can be daunting, especially for beginner options traders.
This is where the Advanced Option Chain (AOC) steps in. AOC is a powerful trading tool designed to simplify option chain analysis. It transforms intricate options data into easily digestible insights using color-coded indicators, percentage-based analysis, and real-time market data, making it easier than ever to identify support and identify resistance with precision.
II. The Mechanics: How Support & Resistance Are Formed by Option Writers
Support and resistance levels in the options market are not arbitrary; they are the direct consequence of the strategic actions of options sellers, specifically Call and Put Writers. These large market participants, often referred to as institutional players, deploy significant capital, and their positions create the "floors" and "ceilings" of price action.
A. Put Writers Create Support Levels
Put Writers (sellers) play a crucial role in establishing support levels. When a Put Writer sells Put Options (PE) at a particular strike price, they anticipate that the underlying asset's price will remain above that level until expiration. Their profit comes from the premium received if the option expires worthless.
Because selling options requires substantial capital and carries significant risk if the price falls below the strike, Put Writers have a strong incentive to defend these levels aggressively. If the market approaches these strikes, Put Writers may engage in hedging activities, such as buying the underlying asset, which generates buying pressure and reinforces the support.
Identifying Strong Support: A strike price demonstrating the highest Open Interest (OI), highest OI Change, or highest Volume in Put Options often indicates a robust support level. The collective interest of Put Writers at this strike creates a strong "floor" preventing the market from falling below it.
✅ Example: If 18,000 PE has the highest Open Interest and Open Interest Change, then 18,000 becomes a Strong Support level.
B. Call Writers Create Resistance Levels
Conversely, Call Writers (sellers) are instrumental in forming resistance levels. When a Call Writer sells Call Options (CE) at a specific strike price, they expect the market to stay below that level. They profit if the option expires out-of-the-money.
Similar to Put Writers, Call Writers actively defend these levels. If the market price approaches or threatens to surpass their sold strike price, their positions risk going into a loss. To prevent this, they may take actions such as selling the underlying asset or buying back calls, which adds selling pressure to the market and reinforces the resistance.
Identifying Strong Resistance: A strike price that exhibits the highest Open Interest (OI), highest OI Change, or highest Volume in Call Options typically signifies a strong resistance level. This concentration of Call Writers at a particular strike creates a formidable "ceiling," making it difficult for the market to rise above it.
✅ Example: If 18,500 CE has the highest Open Interest and Open Interest Change, then 18,500 becomes a Strong Resistance level.
III. Step-by-Step Guide: Finding Support & Resistance with AOC
The Advanced Option Chain (AOC) simplifies the complex task of identifying dynamic support and resistance levels in options trading. With its intuitive interface and visual aids, even beginner options traders can quickly grasp market sentiment. Here’s how to leverage the AOC Calculator for precise S/R analysis:
A. Step 1: Accessing the AOC Option Chain
Your journey begins by accessing the AOC platform:
Visit the AOC Calculator and select your desired index or stock.
Once loaded, your primary focus should be on the OI, OI Change, and Volume columns for both Call Options (CE) and Put Options (PE). These columns are the bedrock of identifying where institutional players are positioning themselves.
B. Step 2: Identifying Key Strike Prices
Identifying the specific strike prices that act as support and resistance is straightforward with AOC:
For Support: The strike price with the highest values across Put Options (PE) in the OI, OI Change, and/or Volume columns indicates a potential support level.
For Resistance: Similarly, the strike price with the highest values across Call Options (CE) in the OI, OI Change, and/or Volume columns signals a potential resistance level.
The strength of these market reversal or market consolidation zones can vary:
They can be formed by any single factor (OI, OI Change, or Volume).
They can be formed by any two factors combined.
The strongest S/R levels are indicated when all three factors (OI, OI Change, and Volume) are highest at a single strike.
Illustrative Examples:
If 18,000 PE shows the highest OI + OI Change, this indicates Strong Support at 18,000.
If 18,500 CE shows the highest OI + OI Change, this points to Strong Resistance at 18,500.
C. Step 3: Confirming Levels with the Percentage Graph
AOC goes beyond raw data by providing visual confirmation:
To use: Simply click the OI tab on any strike price within the AOC interface to open the Percentage Graph.
Benefit: This graph visually compares OI, OI Change, and Volume across all strike prices, making it incredibly easy to spot and confirm the strongest Support & Resistance levels at a glance. It helps visualize potential shifts and the relative strength of different levels.
D. Understanding AOC's Color-Coded Zones
AOC's intuitive color-coded zones offer instant visual recognition of critical levels:
🟢 Green Box: Clearly indicates a Strong Support level.
🔴 Red Box: Highlights a Strong Resistance level.
🟡 Yellow Box: Denotes the 2nd or 3rd strongest level, indicating potential secondary support and resistance levels or areas where a shift in sentiment might be occurring.
These visual cues eliminate the need for laborious manual data analysis, allowing traders to quickly assess the market landscape and make informed trading decisions.
IV. Why AOC is Your Go-To Tool for S/R Analysis
For pro options traders and beginners alike, the Advanced Option Chain (AOC) stands out as a superior trading tool for support and resistance analysis due to its distinct advantages:
A. Real-Time Market Data
AOC provides real-time market data, including live updates on Open Interest (OI), OI Change, and Volume. This ensures that traders are always working with the freshest information, which is critical for making timely and accurate trading decisions in dynamic markets characterized by market reversal, market consolidation, or market breakout scenarios. Unlike delayed data sources, AOC offers the immediate insights needed to react effectively.
B. Percentage-Based View
The platform's percentage-based view offers a significant upgrade over traditional raw figures. Instead of simply seeing large, abstract numbers, AOC contextualizes the data, making it easier to compare the relative strength of support and resistance levels across different strike prices. This simplified comparison enables a quicker and more accurate assessment of where the institutional players are truly concentrating their efforts.
C. Color-Coded Zones
AOC's color-coded zones are a game-changer for visual analysis. Instantly recognizable green, red, and yellow boxes highlight strong support, strong resistance, and secondary levels, respectively. This intuitive visual representation eliminates the need for manual data decoding, allowing traders to quickly identify high probability levels and market sentiment without getting lost in complex spreadsheets. This visual clarity greatly enhances the speed and efficiency of option chain analysis.
V. Conclusion: Trade Smarter. Stay Ahead. Dominate the Market with AOC!
Mastering support and resistance levels is a cornerstone of successful options trading, providing invaluable insights into potential market reversal, market consolidation, and market breakout points. Traditionally, identifying these levels from raw Open Interest (OI), OI Change, and Volume data has been a complex undertaking, often requiring extensive experience and time.
The Advanced Option Chain (AOC) revolutionizes this process, empowering traders with the precision to identify strong, high-probability Support & Resistance levels with unprecedented ease. By leveraging real-time market data, percentage-based analysis, and intuitive color-coded zones, AOC demystifies intricate option chain analysis, allowing both beginner options traders and seasoned pro options traders to effectively read market sentiment and make superior trading decisions.
AOC is more than just a tool; it's your strategic advantage in the market, designed to enhance your options strategy and overall trading performance.
Your Next Steps:
Practice: Dedicate time daily after market hours to backtest by studying historical highest OI, Volume, and OI Change as S/R levels using AOC. This hands-on experience will solidify your understanding.
Engage: Have you spotted significant support or resistance using AOC in your technical analysis? Share your experiences and insights in the comments section below! Your feedback helps the community learn and grow.
Support: If you have any questions about leveraging AOC for your options trading, feel free to ask. We're here to help you every step of the way.
🚀 Trade Smarter. Stay Ahead. Dominate the Market with AOC!
💡 Start using AOC today and take your options trading to the next level!