How to Read OI Graphs in AOC: A Step-by-Step Guide to Smarter Trades
Basic Of AOCAOC Academy

I. Unlocking the Power of OI Graphs in AOC
In the dynamic world of options trading, making informed decisions is paramount. Open Interest (OI) graphs are one of the most powerful analytical tools available within the Advance Option Chain (AOC) trading platform, a comprehensive solution popular among options traders. These charts provide critical insights into market sentiment, participant behavior, and potential future price movements by tracking outstanding option contracts.
By mastering the interpretation of OI graphs, you can significantly enhance your trade confirmation processes and implement robust risk management strategies, ultimately helping you avoid bad trades.
In this detailed guide, you will learn:
How to efficiently access OI and OI Change charts within AOC.
The art of reading CE, PE, and PE–CE line graphs to gauge market sentiment.
How OI slope influences market direction and validates trend strength.
A practical strategy to avoid bad trades using adjacent strike OI signals at critical support and resistance levels.
II. How to Access Specific OI Graphs in AOC
The AOC platform offers advanced OI charts, including percentage graphs and multi-OI graphs for comparing multiple strike prices. For the specific strategy of entry confirmation and entry filtering, you need to access a particular OI graph.
Here's how to open the relevant OI/OI Change graph for a specific strike price in AOC:
Navigate to the option chain interface within the AOC trading platform.
Locate any strike price, whether it's a Call European (CE) or Put European (PE) option.
Click on the "OI Change" value associated with that specific strike price.
This action will instantly open the dedicated OI/OI Change graph for that selected strike, providing a visual representation of the Open Interest dynamics crucial for identifying changing support and resistance levels.
III. Deconstructing the Components of the OI Graph
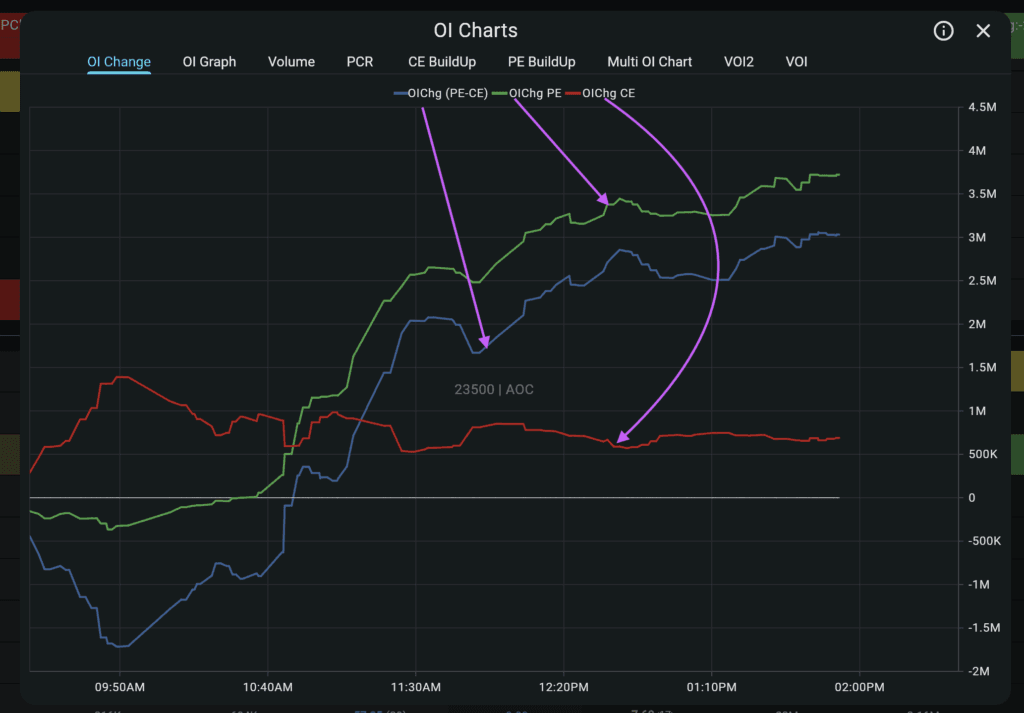
Each OI and OI Change graph in AOC is designed for clarity, featuring three distinct line charts that represent the collective sentiment of market participants.
These graphs typically include:
Red Line (CE): Represents Call Open Interest.
Green Line (PE): Represents Put Open Interest.
Blue Line (PE – CE): Shows the net difference between Put and Call Open Interest.
You have the flexibility to customize your viewing experience from the Menu → Chart Settings and Accessibility, allowing you to configure default visible lines and line colors to suit your preferences.
A. The Red Line: Interpreting Call Writer Behavior (CE OI / CE OI Change)
The red line on the OI graph specifically illustrates the behavior of Call writers. Call options give the buyer the right, but not the obligation, to buy an underlying asset at a specified price. Call writers (sellers), conversely, are typically bearish or neutral, expecting the price to stay below the strike price. A significant build-up of Call Open Interest at a particular strike price often signals strong resistance levels.
Interpretation of the Red Line's Slope:
Red line rising: Indicates bearish market sentiment. This suggests Call writers are actively adding new short positions, reinforcing the belief that the market or underlying asset's price will either fall or struggle to rise above a certain level.
Red line flat: Signals neutral market sentiment. Call writers are neither aggressively adding nor exiting positions.
Red line falling: Points to bullish market sentiment. This suggests Call writers are actively exiting their positions, potentially due to increasing price action or a shift in their bearish outlook.
Important Note: When analyzing the red line, the slope interpretation and direction of the line are far more critical than the exact numerical values of the Open Interest itself.
B. The Green Line: Interpreting Put Writer Behavior (PE OI / PE OI Change)
The green line on the OI graph reflects the behavior of Put writers. Put options grant the buyer the right to sell an underlying asset at a specified price. Put writers (sellers) are generally bullish or neutral, expecting the price to remain above the strike price. A substantial increase in Put Open Interest at a given strike often suggests that it will act as a strong support level.
Interpretation of the Green Line's Slope:
Green line rising: Indicates bullish market sentiment. This suggests Put writers are adding new positions, confident that the market or underlying asset's price will remain above a specific level, thus creating a support level.
Green line flat: Signals neutral market sentiment. Put writers are maintaining their positions without significant changes.
Green line falling: Points to bearish market sentiment. This occurs when Put writers are exiting their positions, potentially anticipating a price decline below a particular level.
Similar to the red line, focus primarily on the slope interpretation and direction of the green line for accurate insights.
C. The Blue Line: Understanding Net Writers' Sentiment (PE OI – CE OI)
The blue line on the OI graph represents the combined effect of both Call and Put writers, offering a view of the net writers' sentiment for a specific strike. This line is essentially the difference between Put Open Interest and Call Open Interest (PE OI – CE OI), analogous to the insights derived from a Put-Call Open Interest Ratio analysis. It helps to differentiate genuine conviction from short-term price spikes and identify when large institutional players are building or reducing positions.
Interpretation of the Blue Line's Slope:
Rising Blue Line: Signals bullish market sentiment. This indicates a stronger presence of Put writers relative to Call writers, suggesting a net optimistic outlook for that strike.
Flat Blue Line: Implies neutral market sentiment. The combined forces of Put and Call writers are relatively balanced.
Falling Blue Line: Points to bearish market sentiment. This suggests a stronger presence of Call writers relative to Put writers, indicating a net pessimistic outlook for that strike.
This "PE-CE line" provides a holistic view of the market's aggregate commitment at a particular strike, helping traders gauge market sentiment and participation.
IV. Applying OI Graphs for Effective Trade Filtering and Risk Management
Understanding the components of OI graphs is just the beginning. The true power lies in applying this knowledge to filter out weak trades and reduce risk, thereby preventing unnecessary Stop Loss (SL) hits. By integrating OI analysis with identified support and resistance levels, you can significantly improve your trading strategy.
A. How OI Analysis Helps in Avoiding Incorrect Trade Entries
Open Interest analysis serves as a powerful confirmation tool. When combined with price action and trading volume, it helps validate breakouts, reversals, and the strength of a trend. High OI at specific strike prices can act as psychological barriers, strengthening support and resistance levels. Monitoring changes in OI at these strikes indicates whether these levels are strengthening or weakening, helping traders avoid entering trades against strong market commitment.
B. Filtering Bullish Trades (Buying CE or Selling PE)
Bullish trades, such as buying CE (Call options) or selling PE (Put options), are typically initiated from identified support levels.
Rule for Trade Confirmation: When considering a bullish trade, check the OI graph of the strike price just below your identified support level.
Example: If your support is at 23550, check the OI graph for the 23500 strike.
Conditions for a Confirmed Good Bullish Trade: The OI graph of the lower strike must exhibit either a Neutral OR Bullish sentiment.
This means the Red (CE) line should be flat or falling.
The Green (PE) line should be flat or rising.
The Blue (PE–CE) line should be flat or rising.
❌ Avoid the Trade If: The lower strike's OI graph shows a Bearish sentiment (e.g., the red line is rising or the blue line is falling).
Rationale: If the strike price just below your support is showing bearish sentiment, it indicates that Call writers are active there, suggesting significant selling pressure or a belief that prices will not hold above this level. Entering a bullish trade under these conditions means your SL is likely to hit as sellers may actively defend this lower level, weakening your identified support.
C. Filtering Bearish Trades (Buying PE or Selling CE)
Bearish trades, such as buying PE (Put options) or selling CE (Call options), are typically initiated from identified resistance levels.
Rule for Trade Confirmation: When considering a bearish trade, check the OI graph of the strike price just above your identified resistance level.
Example: If your resistance is at 22700, check the OI graph for the 22750 strike.
Conditions for a Confirmed Good Bearish Trade: The OI graph of the upper strike must exhibit either a Neutral OR Bearish sentiment.
This means the Red (CE) line should be flat or rising.
The Green (PE) line should be flat or falling.
The Blue (PE–CE) line should be flat or falling.
❌ Avoid the Trade If: The upper strike's OI graph shows a Bullish sentiment (e.g., the green line is rising or the blue line is rising).
Rationale: If the strike price just above your resistance is showing bullish sentiment, it implies that Put writers (or buyers) are dominating that level, suggesting the resistance is weak or that market participants believe the price could break higher. If buyers are active at this level, your SL may get hit as the price pushes through your expected resistance.
D. Summary Table: OI-Based Trade Filtering Rules
This simple OI-based trade filtering mechanism can eliminate a large percentage of potentially unprofitable entries, acting as a robust risk management tool.
Trade Type | Check OI of Strike | What It Should NOT Be |
|---|---|---|
Buy CE / Sell PE | Strike below support | Bearish |
Buy PE / Sell CE | Strike above resistance | Bullish |
V. Key Considerations and Best Practices for Using OI Graphs
To maximize the effectiveness of Open Interest (OI) graphs in your options trading strategy, keep the following best practices in mind:
Focus on Slope, Not Absolute Numbers: Always prioritize the direction and slope interpretation of the CE, PE, and PE–CE lines. The trend and rate of change are more indicative of shifting market sentiment than the raw OI figures.
Confirmation, Not Prediction: Use OI graphs primarily for trade confirmation and entry filtering, not as a standalone tool for predicting market direction. While rising OI with rising prices confirms a bullish trend, OI is generally considered a lagging indicator; therefore, it's most powerful when used to validate other signals.
Integrate with Comprehensive Technical Analysis: Combine OI analysis with other essential technical analysis tools. This includes monitoring price levels, candlestick patterns, market structure, moving averages, and trading volume. For instance, a breakout with rising OI provides stronger confirmation than price movement alone.
Assess Liquidity: High OI for a particular strike indicates greater liquidity, making it easier to enter and exit positions without significant price impact. Trading in illiquid contracts carries higher risk.
Recognize Overextended Trends and Divergences: At extreme levels, OI can sometimes act as a contrarian indicator. If OI peaks while price action stalls, it could signal an overextended trend and a potential reversal. Similarly, price-OI divergences (e.g., lower price lows but higher OI lows) can suggest institutional accumulation during weakness, hinting at an impending upward movement.
Real-Time Data: The AOC trading platform provides real-time updates and the fastest data refresh, crucial for tracking "smart money" movements through live Open Interest changes.
VI. Conclusion: Smarter Trading with OI Graphs
Mastering Open Interest (OI) graphs in AOC empowers you with a sophisticated lens through which to view market dynamics. By systematically learning how to access and interpret the behavior of Call writers (CE OI), Put writers (PE OI), and the crucial net writers' sentiment (PE-CE line), you gain an invaluable edge.
Integrating this market analysis with your existing trading strategy at key support and resistance levels provides a robust framework for trade confirmation and effective risk management. This simple yet powerful check can significantly reduce the percentage of bad trades you encounter, leading to more confident and profitable decisions.
In upcoming chapters, we will delve into practical applications, applying OI graph interpretation to real chart examples to solidify your understanding and expertise.