Percentage Graph in Advanced Option Chain (AOC): Unlock Smarter Trading Insights
Basic Of AOCAOC Academy

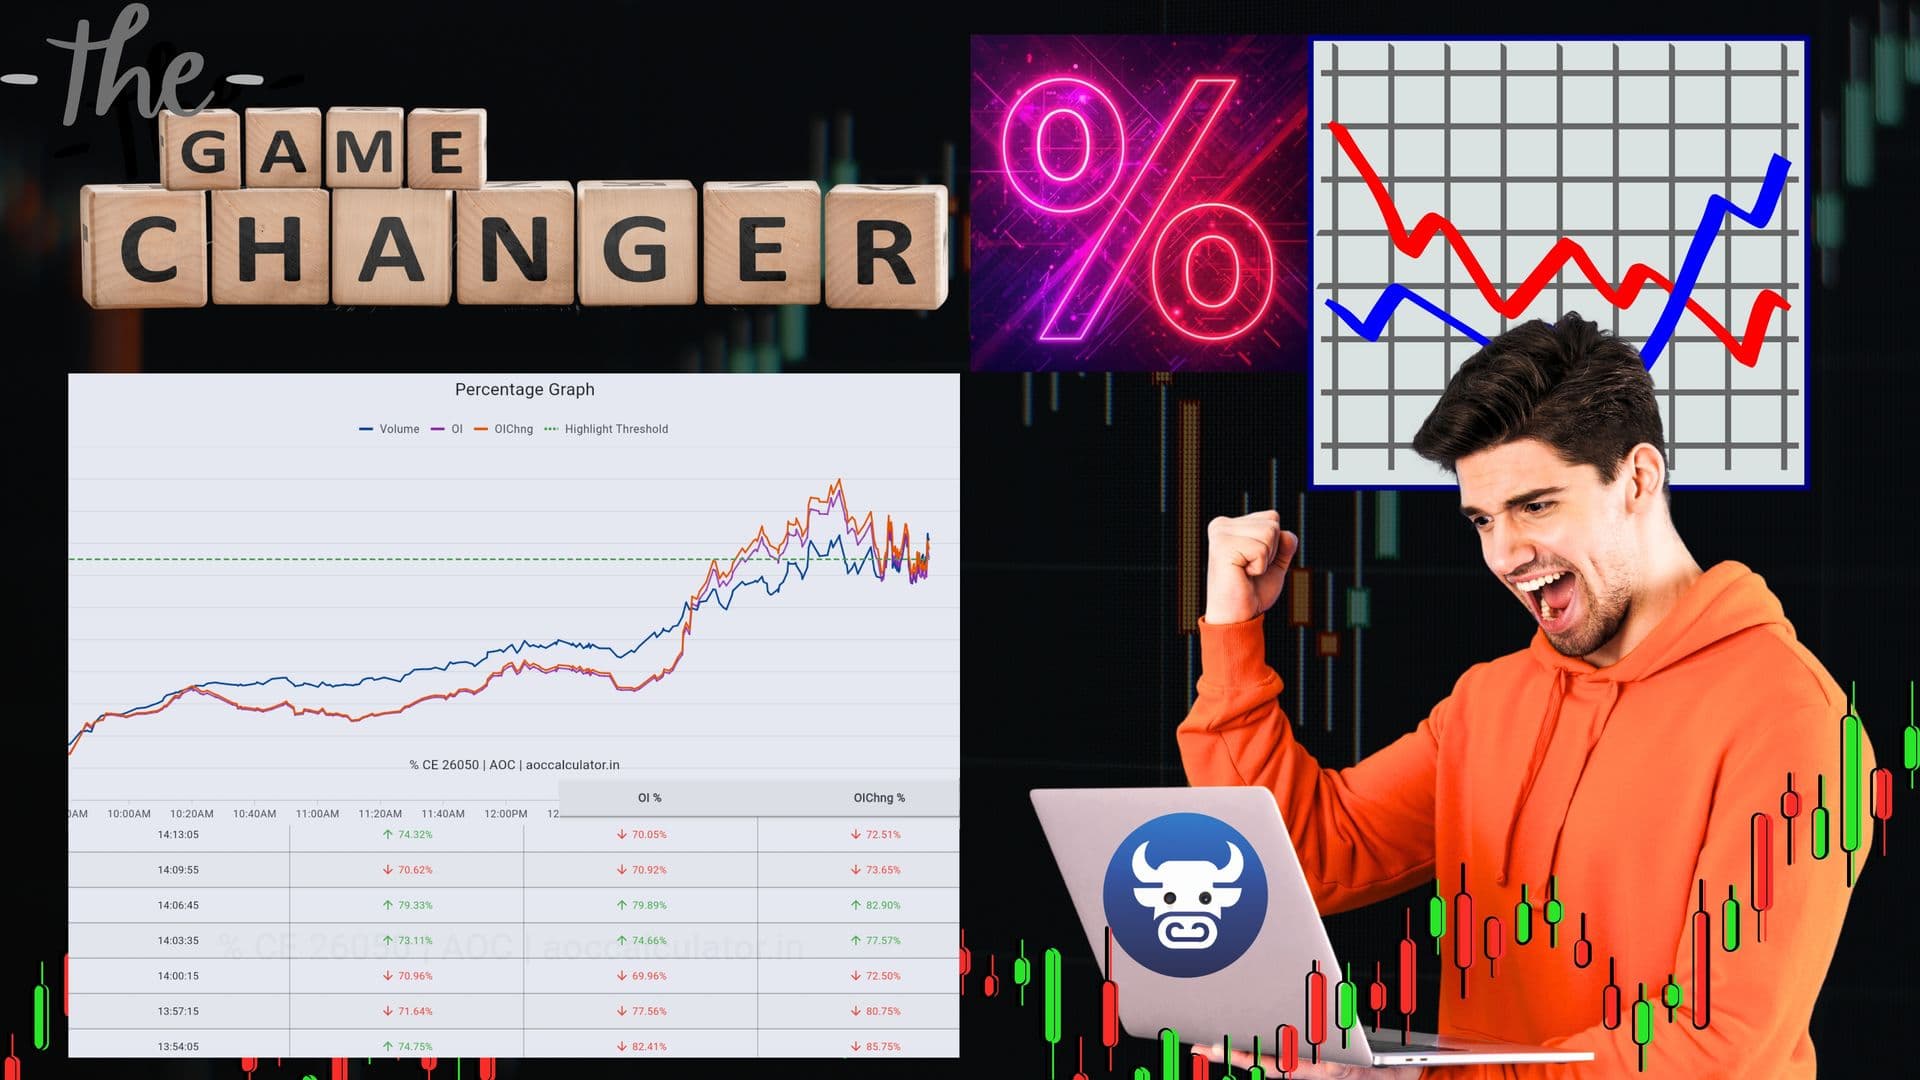
I. Introduction: Simplifying Complex Option Data with the Percentage Graph
Option trading involves navigating a vast sea of data, often presented in raw, complex formats within traditional option chains. For traders, interpreting millions or billions in Volume or Open Interest (OI) across numerous strike prices can be daunting, leading to missed opportunities or delayed trading decisions. The challenge lies in converting this raw data into actionable market insights quickly and efficiently.
This is where the Percentage Graph in Advanced Option Chain (AOC) emerges as a powerful solution. Designed to simplify complex option data analysis, the Percentage Graph transforms large numerical values of Volume, Open Interest (OI), and OI Change into easily digestible percentages. This normalization process offers effortless comparison of trading activity across various strike prices, enabling traders to detect crucial market trends and shifts in market sentiment with unprecedented speed and clarity. It's a game-changer for anyone looking to enhance their option analysis toolset and improve trading strategies.
II. What is the Percentage Graph in AOC?
The Percentage Graph within an Advanced Option Chain (AOC) is a sophisticated analytical feature that visually represents key options metrics: Volume, Open Interest (OI), and OI Change. Instead of displaying the raw, absolute numerical values, which can often be in the millions or even billions, AOC converts these figures into percentages relative to the highest value recorded for that specific metric within the option chain.
A. Visual Representation of Key Metrics
This innovative visualization allows traders to see at a glance how Volume, OI, and OI Change compare across different strike prices. By normalizing the data, the graph focuses on the relative significance of activity rather than the absolute size of the numbers. The strike price exhibiting the highest value for Volume, OI, or OI Change at any given moment is plotted at 100%, with all other strikes displayed as a percentage of that peak.
B. Why the Percentage Graph is Crucial for Traders
The benefits of this simplified analysis are substantial:
Enhances Data Interpretability: It makes complex option data far easier to interpret, especially for beginners, removing the need to manually compare large, unwieldy numbers.
Highlights Sudden Market Spikes and Shifts: Traders can quickly spot significant increases or decreases in activity, which often signal impending market trends or changes in market positioning.
Aids in Identifying Support, Resistance, and Institutional Footprints: Concentrated areas of high percentage OI or Volume often act as strong support and resistance levels. Sudden spikes in OI Change % can reveal where large institutional activity is occurring, offering clues about potential market direction.
III. Understanding the Percentage Graph Calculation
The core strength of the Percentage Graph lies in its ability to normalize option data, making comparisons intuitive. AOC achieves this through straightforward percentage calculations for Volume, OI, and OI Change.
A. Core Principle: Normalizing Absolute Values
The principle is simple: each strike's absolute value for a given metric (Volume, OI, or OI Change) is expressed as a percentage of the highest absolute value for that same metric across the entire option chain. This provides a clear, relative view of where the most significant trading activity and market interest lie.
B. Calculation Formulas for Percentages
The percentage calculation formulas are as follows:
Volume % = (Strike Volume ÷ Highest Volume) × 100
OI % = (Strike OI ÷ Highest OI) × 100
OI Change % = (Strike OI Change ÷ Highest OI Change) × 100
C. Practical Example: Call Side Volume Percentage Calculation
Let's illustrate with an example for the Call side Volume:
Strike | Volume | Percentage Result |
|---|---|---|
22900 CE | 1.47B | 100% (Highest Volume) |
22950 CE | 985M | (985M ÷ 1.47B) × 100 = 67% |
22850 CE | 414M | (414M ÷ 1.47B) × 100 = 28.2% |
The same logic applies to OI% and OI Change%, utilizing their respective highest values across the option chain to derive their percentages.
IV. How to Read and Interpret the Percentage Graph
Navigating the Percentage Graph is intuitive once you understand its axes and dynamic nature. This technical analysis tool provides a real-time visual overview of the options market.
A. Graph Axes Explained
X-Axis: Time from 9:15 AM to 3:30 PM (NSE trading hours) The horizontal axis represents the trading day, tracking market movement throughout the standard NSE trading hours. This allows traders to observe how metrics evolve over time.
Y-Axis (0–100%): Percentage Representation of Volume, OI, and OI Change The vertical axis quantifies the relative strength of Volume, OI, and OI Change, scaled from 0% to 100%. The 100% mark always indicates the strike price with the highest current value for the selected metric.
B. Key Observations and Dynamics
100% Signifies the Highest Current Activity: A strike appearing at 100% on the graph for Volume, OI, or OI Change simply means it currently holds the highest value for that specific metric within the entire option chain.
Dynamic Shifts When a New Strike Surpasses the Previous High: The graph is highly dynamic. As market activity evolves and new trades occur, if another strike's Volume, OI, or OI Change surpasses the current highest value, that new strike will become the 100% marker. Consequently, the previous 100% strike will adjust downwards to reflect its new relative percentage. This continuous recalculation provides real-time data and an instant visual update of shifting market positioning and momentum shifts.
V. Key Components of the Percentage Graph and Their Significance
The Percentage Graph is composed of distinct lines, each offering unique insights into option trading dynamics. Understanding these components is vital for effective data analysis and formulating robust trading strategies.
A. Volume (Blue Line): Indicating Trading Activity and Liquidity
The blue line on the Percentage Graph represents Volume %. It shows the percentage of contracts traded at a specific strike price relative to the highest volume strike.
Significance: High Volume % suggests active trading at that level, indicating strong market interest and good liquidity zones. This makes it easier for traders to enter or exit positions without significant price impact. Consistently high volume often confirms the significance of a particular strike.
B. Open Interest (Purple Line): Showing Market Participation and Positioning
The purple line illustrates OI %, which is the total number of outstanding contracts (positions not yet closed or exercised) as a percentage of the highest OI strike.
Significance: A higher OI % at a strike indicates significant market participation and commitment from traders, reflecting the amount of money invested in those contracts. It can point to potential support and resistance levels where large numbers of contracts are open, signaling areas where market participants have taken strong market positioning.
C. OI Change (Orange Line): Revealing Fresh Long/Short Buildup or Unwinding
The orange line displays OI Change %, showing the percentage change in Open Interest from the previous trading session relative to the highest OI Change.
Significance:
An increase in OI Change % suggests that new positions are being opened (fresh long/short buildup). This often indicates new money flowing into the market.
A decrease in OI Change % implies that existing positions are being closed or unwound. Analyzing OI Change alongside price movements is crucial for gauging the strength of a trend or anticipating potential reversals, making it a powerful indicator of immediate market sentiment.
D. How These Components Empower Traders
By integrating these three visual components, the Percentage Graph empowers traders to:
Identify Most Active Strike Prices: Quickly pinpoint where the bulk of trading activity and interest is concentrated.
Track Institutional Positioning: Sudden spikes or sustained high percentages can reveal where large institutions are building or unwinding positions, providing clues for institutional activity.
Confirm Market Trends with Data: Use the confluence of Volume, OI, and OI Change to validate price movements and strengthen the conviction behind market trends, moving beyond mere guesswork.
VI. Leveraging the Percentage Graph for Strategic Trading
The Percentage Graph in AOC is not just an informative display; it's a powerful tool for actionable trading strategies. It allows for a deeper dive into financial markets beyond simple price action.
A. Accessing the Percentage Graph in AOC
To harness the power of this feature, simply click on the OI tab of any strike price within the Advanced Option Chain. This action will typically reveal the dynamic Percentage Graph, ready for analysis.
B. Practical Applications for Traders
Finding Market Interest and High Liquidity Zones: Look for strike prices with the highest Volume % and OI %. These are typically zones of high liquidity and significant market interest, making them attractive for trade entry and exit.
Confirming Trend Continuation:
Bullish Trend: A rising price coupled with consistently rising OI % (especially for calls at higher strikes or puts at lower strikes) often confirms a strong bullish trend, indicating new money entering the market.
Bearish Trend: A falling price with increasing OI % (for puts at lower strikes or calls at higher strikes) can signal new short positions, confirming a bearish trend.
Spotting Institutional Activity: Keep an eye out for sudden, sharp spikes in OI Change %. Such movements often indicate significant institutional activity or the entry of "smart money," which can precede major market moves.
Enhancing Decision-Making: By providing deeper data and visual cues, the Percentage Graph allows for more informed and confident trading decisions than relying solely on price action or raw numbers.
C. Interpreting Specific Market Behavior
The interplay between OI% and OI Change% offers nuanced insights:
OI% ↑ + OI Change% ↑: This combination indicates that new, strong positions are being opened. This could be bullish (e.g., fresh long calls or short puts) or bearish (e.g., fresh long puts or short calls), depending on the underlying price movement and the specific option type (Call or Put).
High Volume but Falling OI: This scenario often suggests profit booking or unwinding of existing positions rather than the initiation of new ones. It can signal a potential exhaustion of a trend or a shift in sentiment as traders close out their contracts.
VII. Dynamic Market Behavior Within the Percentage Graph
The real power of the Percentage Graph lies in its dynamic nature, offering real-time data on momentum shifts and evolving market sentiment. It’s crucial to understand that the 100% mark is relative and constantly changing.
A. The Relative Nature of 100% OI Change
When a strike shows 100% OI Change, it simply means it currently holds the highest OI Change value across the entire option chain. This does not inherently signify strong buying pressure; it could equally represent aggressive selling, depending on whether it's a Call or Put option and the underlying price action. It primarily highlights where the most new positions (or closing of positions) are occurring relative to other strikes.
B. Example of Dynamic Shifting: One Strike Overtaking Another
Consider this dynamic example:
Initially, the 18,000 PE (Put Option at strike price 18,000) might be showing 100% OI Change, indicating the highest activity for puts at that moment.
However, as trading activity progresses, if the 18,200 PE suddenly experiences a greater influx of new positions (or unwinding), it could overtake the 18,000 PE.
In this event:
The 18,200 PE would then instantly become the new 100% mark for OI Change.
The 18,000 PE would automatically drop to a lower percentage, reflecting its new relative standing.
C. Significance: Instantly Recognizing Momentum Shifts
This continuous, dynamic recalculation and visualization allows traders to:
Instantly recognize where momentum is shifting: By observing which strikes are rising to 100% or rapidly increasing their percentage, traders can quickly identify new areas of market focus.
Gauge strengthening support or resistance: A consistent increase in the percentage of Put OI at a lower strike price, especially during a price decline, suggests strengthening support as more traders sell puts at that level. Conversely, increasing Call OI percentage at a higher strike during a price rally points to strengthening resistance.
Confirm or reverse trends: If the underlying price is rising, and the percentage of total Open Interest (particularly Call OI) is also steadily increasing across higher strike prices, this confirms a strong bullish trend. Conversely, if price rises but OI percentage declines, it may signal weakening momentum or short covering, hinting at a potential reversal.
Utilize "OI Change Percentage" for immediate moves: A sudden spike in OI Change percentage for a specific strike, whether Call or Put, points to rapid position initiation by significant players, providing clues for short-term direction or crucial intraday levels.
Such dynamic views are crucial for making timely trading decisions in fast-moving financial markets, allowing traders to react to evolving market conditions rather than just static data.
VIII. AOC Percentage Graph vs. Traditional Option Chains: A Comparative Advantage
The Advanced Option Chain (AOC) Percentage Graph offers a significant leap forward compared to conventional option chains. It transforms how traders interact with and interpret option data, providing distinct advantages for market analysis.
A. Feature Comparison Table
Feature | Traditional Option Chain | AOC Percentage Graph |
|---|---|---|
Data Presentation | Shows raw, absolute values (Volume, OI, Greeks). | Converts Volume, OI, and OI Change into easy-to-read percentages. Uses visual lines to simplify data, often color-coded (e.g., blue for Volume, purple for OI, orange for OI Change). |
Trend Detection | Slow, requires manual comparison and mental calculations. | Real-time dynamic comparison, allowing for quick visual identification of market trends and shifts. |
Visual Insight | Limited to static numerical tables. | Offers multi-line visual analysis, making patterns and concentrations immediately apparent. |
Market Sentiment | Limited, inferred through laborious analysis of absolute numbers. | Instantly visible through percentage shifts, dynamic movements, and the relative strength of Call vs. Put OI percentages, often integrated with Put/Call Ratio (PCR). |
Ease of Analysis | Requires active interpretation of large, absolute numbers. | Normalizes data, simplifying comparisons and accelerating the identification of significant concentrations or shifts in trading activity and market sentiment. |
Primary Focus | Detailed contract-specific information. | Comparative analysis of market interest and sentiment across different strike prices and expiration dates through normalized data. |
Dynamic Insights | Primarily a static snapshot, requiring external tools for tracking. | Built for dynamic analysis, allowing traders to track shifting market sentiment in real-time data and observe how percentage distributions change over the trading day. |
Use Case | Basic option parameters, trade execution. | Rapid identification of market trends, significant institutional activity, confirmation of price movements, and enhanced trading decisions beyond just price action. |
B. Core Advantages of AOC’s Percentage Graph
The superiority of AOC's Percentage Graph stems from several key aspects:
Simplified Understanding Through Normalized Values: By converting raw data into percentages, AOC demystifies complex derivatives trading data, making it accessible and understandable for traders of all experience levels.
Faster Decisions Via Quick Comparison: The visual, normalized data allows for instantaneous comparisons across strike prices, facilitating quicker and more confident trading decisions in fast-paced financial markets.
Real-Time Market Sentiment Tracking: The dynamic nature of the graph, constantly updating percentages as trading activity unfolds, provides a real-time pulse of market sentiment, enabling traders to react to evolving conditions.
Accessibility for Traders of All Experience Levels: Whether a beginner or an advanced trader, the intuitive visual interface lowers the barrier to entry for sophisticated option analysis, supporting better trading strategies for everyone.
IX. Conclusion: The Game-Changing Power of AOC's Percentage Graph
The Percentage Graph in Advanced Option Chain (AOC) is more than just a feature; it's a transformative tool that redefines how traders engage with complex option data. By converting overwhelming raw numbers into simple, dynamic visual percentages, AOC empowers market participants to gain profound insights that were once the exclusive domain of highly experienced professionals.
A. Recap of Benefits
This innovative option analysis tool equips you to:
Decode Institutional Activity: Easily spot areas of significant Volume, Open Interest (OI), and OI Change that often signal the footprints of large institutional players.
Understand Market Sentiment: Get a clear, real-time picture of whether the market is turning bullish or bearish at specific strike prices and identify key support and resistance levels.
Track Volume/OI Trends: Effortlessly monitor how trading activity and market positioning evolve throughout the day, providing crucial context to price movements.
Enable Faster and More Accurate Trading Decisions: With simplified analysis and clear visual cues, you can make informed decisions quickly, reducing guesswork and increasing confidence in your trading strategies.
B. Call to Action: Start Using AOC’s Percentage Graph for Confident Trading
In the dynamic world of derivatives trading, having an edge means having clarity. The AOC Percentage Graph provides that clarity, turning complex option data into actionable intelligence. Don't let valuable market trends and institutional activity pass you by.
Start using AOC's Percentage Graph today and trade with confidence! Unlock smarter insights and elevate your option trading journey.