Shifting Support & Resistance in AOC: An Advanced Guide for Traders
Basic Of AOCRaj Shah

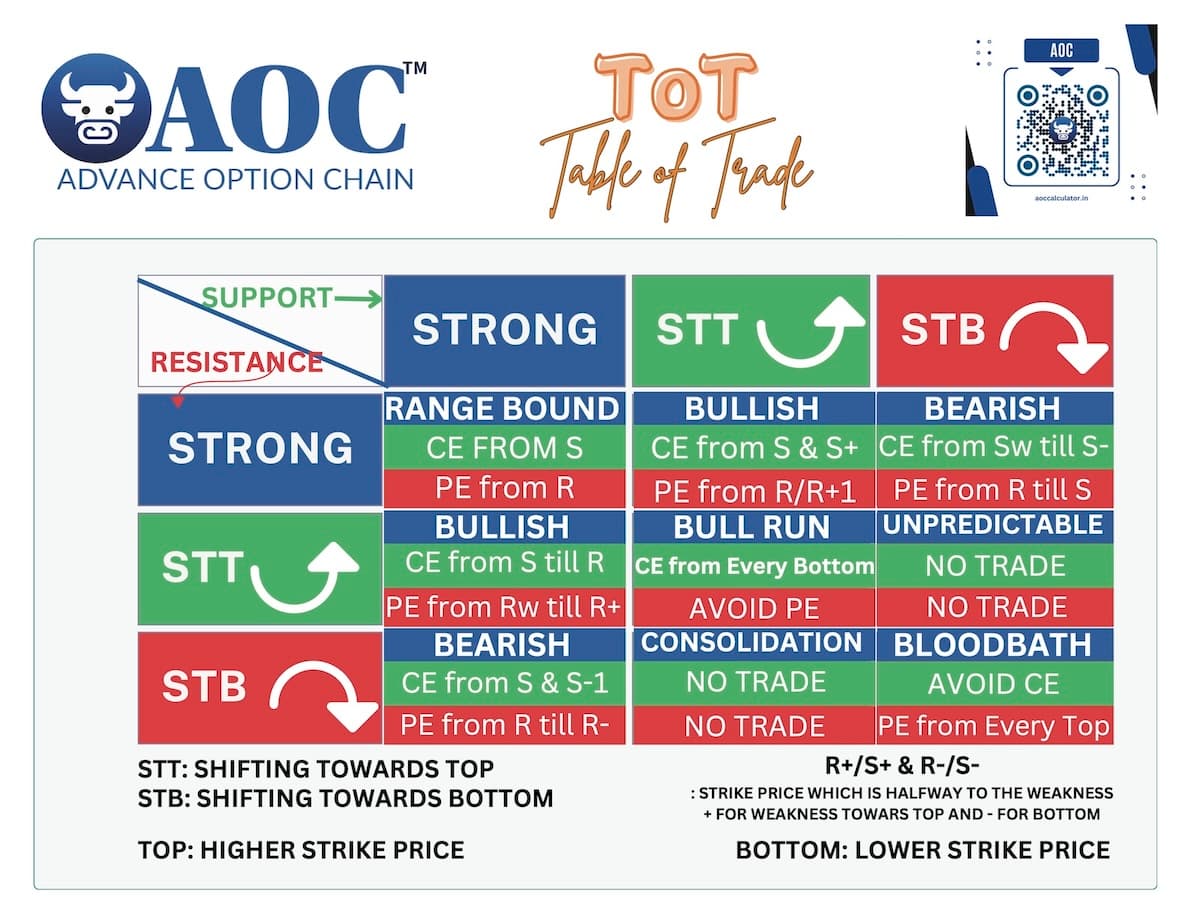
The Dynamic Edge of Shifting Support & Resistance in AOC
For traders seeking to navigate the financial markets with precision, understanding Shifting Support & Resistance in AOC (Advanced Option Chain) is not just beneficial—it's crucial. Unlike traditional, static support and resistance levels that remain fixed, AOC revolutionizes market analysis by dynamically updating these critical zones based on real-time Open Interest (OI), Volume, and OI Change. This dynamic approach offers a responsive view of market sentiment, helping traders identify potential price movements before they fully materialize.
This comprehensive guide will explain how these vital shifts occur, differentiate between strong vs. weak Support & Resistance (S/R), and introduce you to the specific types of shifts: STT (Shifting Towards Top), STB (Shifting Towards Bottom), SFB (Shifted From Bottom), and SFT (Shifted From Top). We will also delve into the methodology for identifying and confirming these S/R changes using AOC’s innovative Percentage Graph, empowering you to leverage AOC’s AI-powered analysis for a more robust trading strategy.
What is Support & Resistance in AOC?
In general technical analysis, support is a price level where demand is strong enough to prevent the price from falling further, while resistance is a price level where supply is strong enough to halt an uptrend.
In the context of AOC (Advanced Option Chain), support and resistance are identified not from traditional price charts, but primarily from the real-time options data. These levels are essentially price points where market sentiment and the positioning of "big players" (institutional traders) indicate a likely pause or reversal in the prevailing market trends.
Support Defined:
A Support level is a price floor where demand is expected to overcome supply, preventing prices from falling further. The market is likely to bounce upward from this zone.
This level is typically driven by Put Writers (sellers of put options) who defend this zone aggressively. They profit if the price stays above their strike, making them keen to prevent declines.
Resistance Defined:
A Resistance level is a price ceiling where supply is expected to overpower demand, hindering prices from rising further. The market is likely to reverse downward from this zone.
This level is primarily driven by Call Writers (sellers of call options) who try to prevent prices from rising above their strike to protect their positions and realize profit.
How AOC Identifies S/R
AOC identifies these powerful strike price levels based on the highest concentration of three key factors:
Volume: Represents the total number of trades that have occurred at a particular strike price. High volume signifies heightened market engagement and strengthens that S/R zone.
Open Interest (OI): The total number of outstanding or unsettled contracts for a particular option at a strike price. High OI indicates strong trader positioning and liquidity.
OI Change: The daily increase or decrease in open contracts. Significant OI Change highlights real-time shifts in market sentiment and the entry or exit of large players, offering insights into live market dynamics.
Any one, two, or all three of these factors together can form a strong support or resistance. A fundamental rule in Option Chain analysis is that resistance levels are found above the spot price, while support levels are located below the spot price.
Strong vs. Weak Support & Resistance Levels
Understanding the difference between strong and weak S/R levels is critical for option trading, as it informs the probability of a level holding or breaking. AOC provides clear indicators for this differentiation.
Strong Support & Resistance
A level is considered strong in AOC if it holds 100% Volume, OI, or OI Change at that specific strike price. This indicates:
Aggressive Defense: Big players are aggressively defending this zone, signaling "no weakness." They have significant capital invested and will likely resist price breaches.
Example: If the 18,000 Put Option (PE) strike price has the highest OI and OI Change with 100% strength, it is identified as a strong support. Similarly, for Call Options (CE), 100% strength indicates strong resistance.
Weak Support & Resistance
A level is considered weak if another strike price now holds 75% or more of the Volume, OI, or OI Change compared to the current dominant S/R level. This indicates:
Potential for Shift: This "weakness" at a new strike price signals that the existing S/R level is losing its dominance and a shift is underway or imminent.
Shift Trigger: If this weakness in the competing strike price becomes 100%, the original S/R level completely shifts to the new strike price.
Example: If 18,000 PE previously held strong support, but now 18,200 PE starts accumulating 75% or more of the OI Change, it suggests the support is shifting towards 18,200. The 18,000 level is now considered weak.
Types of Shifting Support & Resistance in AOC
AOC categorizes S/R shifts into four distinct types, providing traders with real-time cues about market direction and conviction. These shifts apply to both support and resistance.
🟢 STT (Shifting Towards Top)
Definition: STT indicates that either a Support or Resistance level is attempting to shift to a higher strike price. This signals bullish pressure in the market.
Example: If 18,000 was the current support, but a higher strike, say 18,200, now exhibits 75% or more of the OI, Volume, or OI Change, the support is considered to be Shifting Towards Top.
Status: The shift is not yet complete. It signifies that the market is trying to establish a higher base or ceiling.
Transition: If this new level at 18,200 reaches 100% strength in its metrics, the shift becomes complete, moving to SFB.
🔴 STB (Shifting Towards Bottom)
Definition: STB signifies that either a Support or Resistance level is attempting to shift to a lower strike price. This indicates bearish pressure in the market.
Example: If 18,500 was the current resistance, but a lower strike, like 18,300, now holds 75% or more of the OI, Volume, or OI Change, the resistance is Shifting Towards Bottom.
Status: The shift is not yet confirmed. It suggests the market is trying to establish a lower ceiling or floor.
Transition: If this new level at 18,300 reaches 100% strength, the shift is complete, becoming SFT.
🟢 SFB (Shifted From Bottom)
Definition: SFB means that a Support level has completely shifted to a new, higher strike price. This is a confirmed bullish development.
Example: The 18,000 support fully shifts to 18,200 because the latter now holds 100% of the highest OI, Volume, or OI Change.
Outcome: The original 18,000 level now has little to no value as support; 18,200 is the new confirmed support.
🔴 SFT (Shifted From Top)
Definition: SFT signifies that a Resistance level has completely moved down to a new, lower strike price. This is a confirmed bearish development.
Example: The 18,500 resistance fully shifts to 18,300 because the latter now holds 100% of the highest OI, Volume, or OI Change.
Outcome: The original 18,500 level now has little to no value as resistance; 18,300 is the new confirmed resistance.
Key Rule: These dynamic Support Resistance shift dynamics are universal and apply equally to both support and resistance levels.
How to Identify Potential S/R Changes in AOC (Pre-confirmation)
To effectively detect if Support & Resistance might change, follow these steps within your AOC (Advanced Option Chain) platform:
Identify Current S/R: Pinpoint the existing strong support and resistance strike prices.
Monitor Weakness: Check if another strike price (either higher or lower) is accumulating 75% or more of the Volume, Open Interest (OI), or OI Change compared to the current dominant level.
Hypothesize Completion: Mentally assume that this developing weakness (75% concentration) could potentially reach 100%.
Evaluate Impact: Consider if this hypothetical complete shift would alter the current support or resistance levels.
Seek Confirmation: Emphasize that the final step for certainty is to confirm this potential shift using the Percentage Graph in AOC.
Confirming S/R Shifts with AOC’s Percentage Graph
While observing OI, Volume, and OI Change provides strong indications, the AOC’s Percentage Graph offers a visual and definitive confirmation of Shifting Support & Resistance.
Navigation: Within the AOC option chain, click on the OI tab associated with the relevant strike price. This will display the Percentage Graph.
Interpreting the Percentage Graph:
🟢 Green Box: A green box on the graph clearly indicates a Strong Support level. This is where Put Writers are firmly entrenched.
🔴 Red Box: A red box on the graph highlights a Strong Resistance level. This signifies where Call Writers are aggressively defending.
🟡 Yellow Box: A yellow box is your alert for potential shifts. It signifies the 2nd or 3rd strongest level—a critical area to watch for developing weakness and a possible future shift in support or resistance.
By leveraging this visual tool, traders can gain higher conviction in their analysis of real-time market data and upcoming market movements.
Why Shifting Support & Resistance Matters for Traders (Key Takeaways)
Mastering Shifting Support & Resistance in AOC provides a significant competitive edge for Option trading:
Dynamic vs. Static: Unlike traditional S/R, AOC offers dynamic, real-time updates of crucial levels, adapting to evolving market trends and conditions. This ensures your analysis is always current and relevant.
Early Signals & Confirmation: STT and STB serve as early signals of ongoing shifts, allowing traders to anticipate market direction. SFB and SFT provide definitive confirmation of these completed shifts, enhancing trading confidence.
Proactive Market Detection: By closely tracking OI, OI Change, and Volume, traders can detect potential market shifts and institutional positioning before they fully happen, enabling proactive decision-making.
Enhanced Accuracy & Risk Management: Utilizing the Percentage Graph in AOC to confirm shifts ensures better trade accuracy and helps in minimizing risk by entering or exiting trades at optimal price points.
Informed Strategy: This advanced approach to technical analysis allows for the development of a more adaptable and robust trading strategy, significantly boosting your market comprehension and overall trading performance.
Conclusion & Call to Action
The ability to accurately identify and interpret Shifting Support & Resistance in AOC is a powerful asset for any serious trader. By moving beyond static price levels and embracing the dynamic insights offered by Open Interest, Volume, OI Change, and the intuitive Percentage Graph, you can gain a deeper understanding of market forces and make more informed decisions.
Want to improve your trading strategy? Track Shifting Support & Resistance with AOC’s AI-powered analysis today!
📊 Ready to Trade Smarter? Start using AOC today and stay ahead of the market! 🚀
👉 Explore More: Visit AOC Option Chain